If you use Ag-Grid to display grids for tabular data in your web applications, you may have a need to export the data into Microsoft Excel. While exporting works great out of the box, numbers that are formatted into Currency or other number amounts via the Value Formatter will export the underlying (raw) values instead. There is a way to have the best of both worlds - export the raw data AND preserve the display that we already determined to be helpful to our users. The way to do so is using the Excel Styles provided by Ag-Grid and thats what this write up covers.
Say you have a grid that shows car sales data as listed below. Notice a couple things about the Purchase Price, Sale Price, and Profit columns:
- displayed in dollar amounts
- in red color when negative AND
- the number columns get a css class
currencywhen positive (or zero) andnegative-currencywhen less than zero. (This will be important shortly)
Clicking the export button should download an Excel workbook with the data but observe that the numbers displayed are the raw (unformatted) values. While this is a great start, wouldn’t it be nicer if we maintained the same display from the web app?
In order to format and style the data for Excel, we can pass an excelStyles configuration array. This array should contain Excel Styles which are objects that specify an id (corresponding to the css class) and and what styles & formatting should be applied to that id. We will only be making use of the Excel style’s font and numberFormat properties today but there are so many more available in Ag-Grid’s docs that give you control over other things like cell colors, borders, hyperlinks, and many more.
Here is how the solution unfolded:
    {
        id: "negative-currency", // 👈 target the columns using the css class
        font: {
            color: "#ff0000"     // 👈 specify the red font color
        },
        numberFormat: {
            format: "[Black] $#,###; [Red]$(#,###)" // 👈 specify the formatting Red for negatives, black for everything else. We go a step further and show negatives in parentheses which some folks prefer to using the minus (-) symbol.
        }
    }
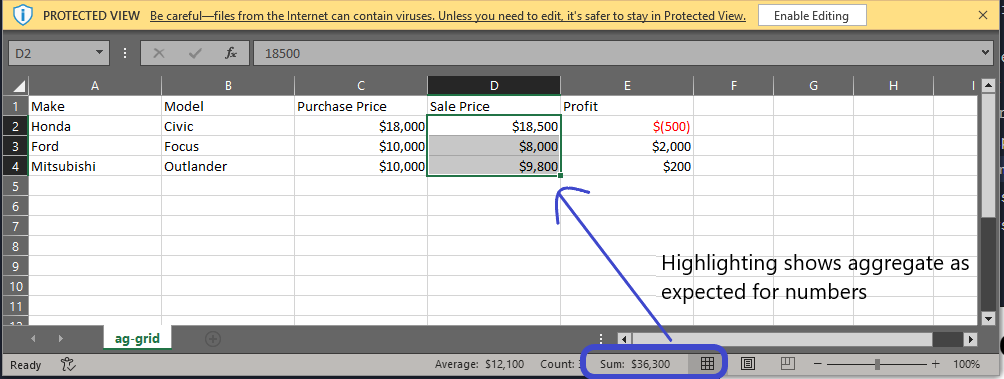
One thing to note about all this is that ag-grid exports this in a way that leverages Excel’s formatting so that the raw values are in the cells - they are just displayed in a way that that makes sense to our users. This means arithmetic operations can be done on the cells and clicking on each cell will still show the raw value as shown below:

Working with Excel Styles has a lot of similarities with styling a webpage using CSS and is fairly easy to understand. Feel free to dig into the Ag-Grid documentation for more details.